
A DDaT workplace picture taken at the office, August 2019
Objectivity is the nature of performance analysis. We look at data daily across Department for International Trade's (DIT) products and services to provide insight from information. It is our role to work with Digital, Data and Technology (DDaT) teams to ensure that ‘gut-feel’ decisions are rigorously tested before implementation. So how do we go from a ‘hunch’ to a hypothesis to improve performance?
Performance analysis is the linchpin to understanding a product’s journey. With that in mind, a good performance analysis team can generate insights and justify whether a ‘hunch’ will help or hinder a DIT product or service.
What gets measured, gets improved
First of all, data is pivotal. Without it, we have no understanding of impact. As Performance Analysts, it’s important that we observe the 4-step cycle performance model to:
- measure: focused on what we’ll be tracking
- report: focused on presenting the data
- analyse: insight and storytelling are key
- optimise: explore ideas for improvement and begin to get creative on forming hypotheses
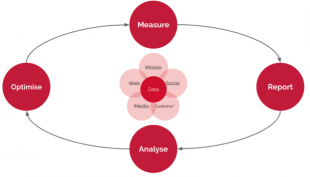
Image caption: Performance analytics model demonstrating the types of data and the 4 main stages: measure, report, analyse and optimise
However, there is no guarantee that this will lead to an improvement, so we need more data.
Let’s get testing
It's important that we choose the right tools to conduct our A/B tests. As outlined in the Service Standard for Performance Analysis, we need to be able to demonstrate the results of A/B and multivariate tests.
For example, we believe that moving a section of text to the top of the page in a service will give the user a better signposting experience. If users have a clear direction of where to go next, then we improve our chances of a website objective being achieved. It’s tempting to use our intuition to predict that this would lead to a better user experience, however there is no certainty.
To address this, there are multiple available tools and types of tests that we can explore. At a basic level, the A/B test is a good method to test our hypothesis.
In an A/B test, when a user engages with a web product, they will either be taken to the original experience (also known as the ‘control’) or an experiment experience where we have made changes based on our hypothesis (‘challenger’). We will need to define a primary goal we want to test in the experiment.
Goals can be as simple as more clicks to a certain area of the website or an increase in form submissions. Once we have collected enough data on our user’s behaviour, we’ll be able to see which version outperforms the other.
In addition to the suite of Google Analytics products, we can use ‘Optimize’ to set up our A/B test. The A/B testing is a tool that exists with Google Analytics.
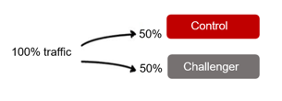
Image caption: In an A/B test, we can split 100% of the traffic, 50/50 to the ‘control’ and ‘challenger’
When and how do we have a winner?
Two factors play a crucial role in determining whether the ‘control’ or ‘challenger’ experience is better for the user, these are sample size and statistical significance.
A sample size is a subgroup in analysis which represents the types of behaviours you would see in the whole group. The statistical significance is the likelihood that the result is not caused by chance. If one experience has a 95% chance of performing better than the other, it is safe to say that we have a statistically significant result. In other words, there is still a 5% chance you could be wrong.
The test will also need to run for enough time in order to collect a sample size that can confirm a statistically significant result.
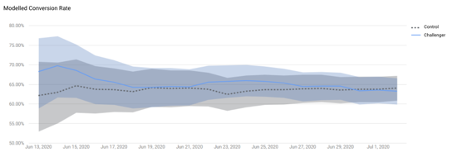
Image caption: A modelled conversion rate graph generated in Google Optimise which demonstrates the daily difference between ‘control’ and ‘challenger’ against the primary objective.
Once both sample size and the result have been determined ‘statistically significant’, one experience will be declared the winner. In addition to this, modelling tools will also be able to summarise how much impact the winning experience will have.
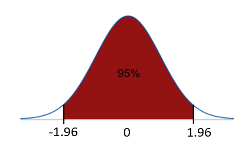
Image caption: A graph illustrating sampling distribution with a confidence level of 5% chance of error
Things to look out for
Time
The more time the test is in play, the lower the chance of error. ‘Optimise’ will require a minimum 2 weeks, however this is just a benchmark. There must be a strong enough representative sample of users’ overtime who have experienced either the A or B experience for us to draw a conclusion.
Secondary objectives
Our primary objective is outlined as the focus during the A/B test set up, however, it is important to recognise the impact the tests have on our secondary objectives. For example, if the ‘challenger’ succeeds in more users going to a certain page, but the exit rate has dramatically increased, is this a sign that the test was successful overall?
No leader found
An inconclusive result is common, but it’s not all bad news. This simply means that the ‘challenger’ neither outperformed nor underperformed against the ‘control’. We can reflect, revise, and re-hypothesise and test again.
What’s next for the Performance Analyst team?
Our aim is for teams to feel comfortable experimenting with new hypotheses and using the available tools to test ideas before implementation. We will continue to work towards this vision as we expand our motivated and talented team.
We will be working closely with product owners to establish performance reviews with products, and with services teams to embed the performance analysis process at each stage. This way we can support teams through data-led decision making throughout the product life cycle.
We are very excited to be growing the performance analysis team and function within DIT. Sign up for job alerts to be notified about the new roles
Enjoyed this blog and interested in the Data team? Read more blogs by the team on Digital Trade